Biodiversity Estimation from Satellite Images
Maintaining and protecting biodiversity of plants and animals is essential for our life on earth. Due to climate change, human destruction of precious habitats, and industrial agriculture, biodiversity is decreasing in many countries. A major bottleneck for counter-measures is lack of accurate, dense biodiversity data at large scale. Today, the main technique to monitor biodiversity is field surveys that assess biodiversity in situ by counting the amount of different species per area. These studies are very labor-intensive, costly, and deliver only scarce, point-wise data. Moreover, the temporal resolution is low because revisit cycles of the test sites are long.
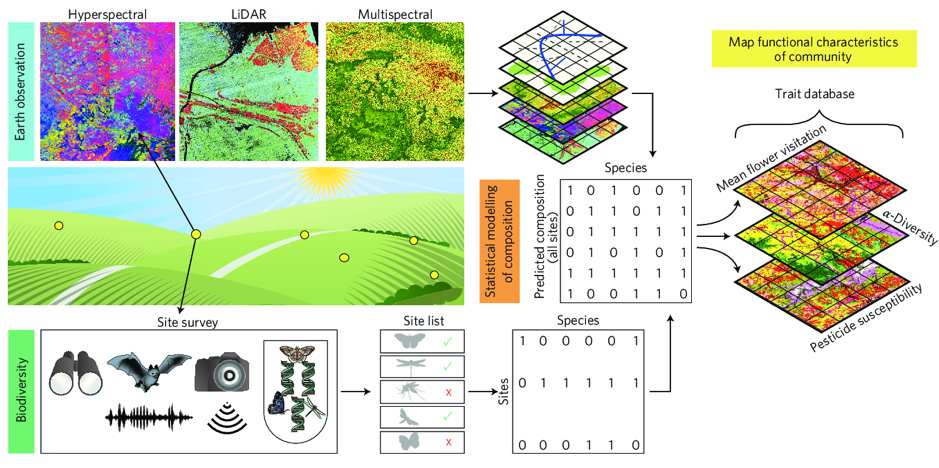
In this project, we aim at automating biodiversity estimation in Switzerland using (deep) machine learning and overhead imagery. We combine point-wise, high-quality in-situ data of Swiss institutions like BLW, Agroscope, BAFU, and WSL that have been conducting field surveys for decades with dense, large-scale satellite imagery. First experiments have shown that the spectral resolution of ESA satellites Sentinel 2, designed for vegetation monitoring, partially allows for plant species recognition on the ground. This project aims at directly mapping different species distributions and biodiversity in Switzerland to help protect the environment and measuring the impact of agriculture on biodiversity.
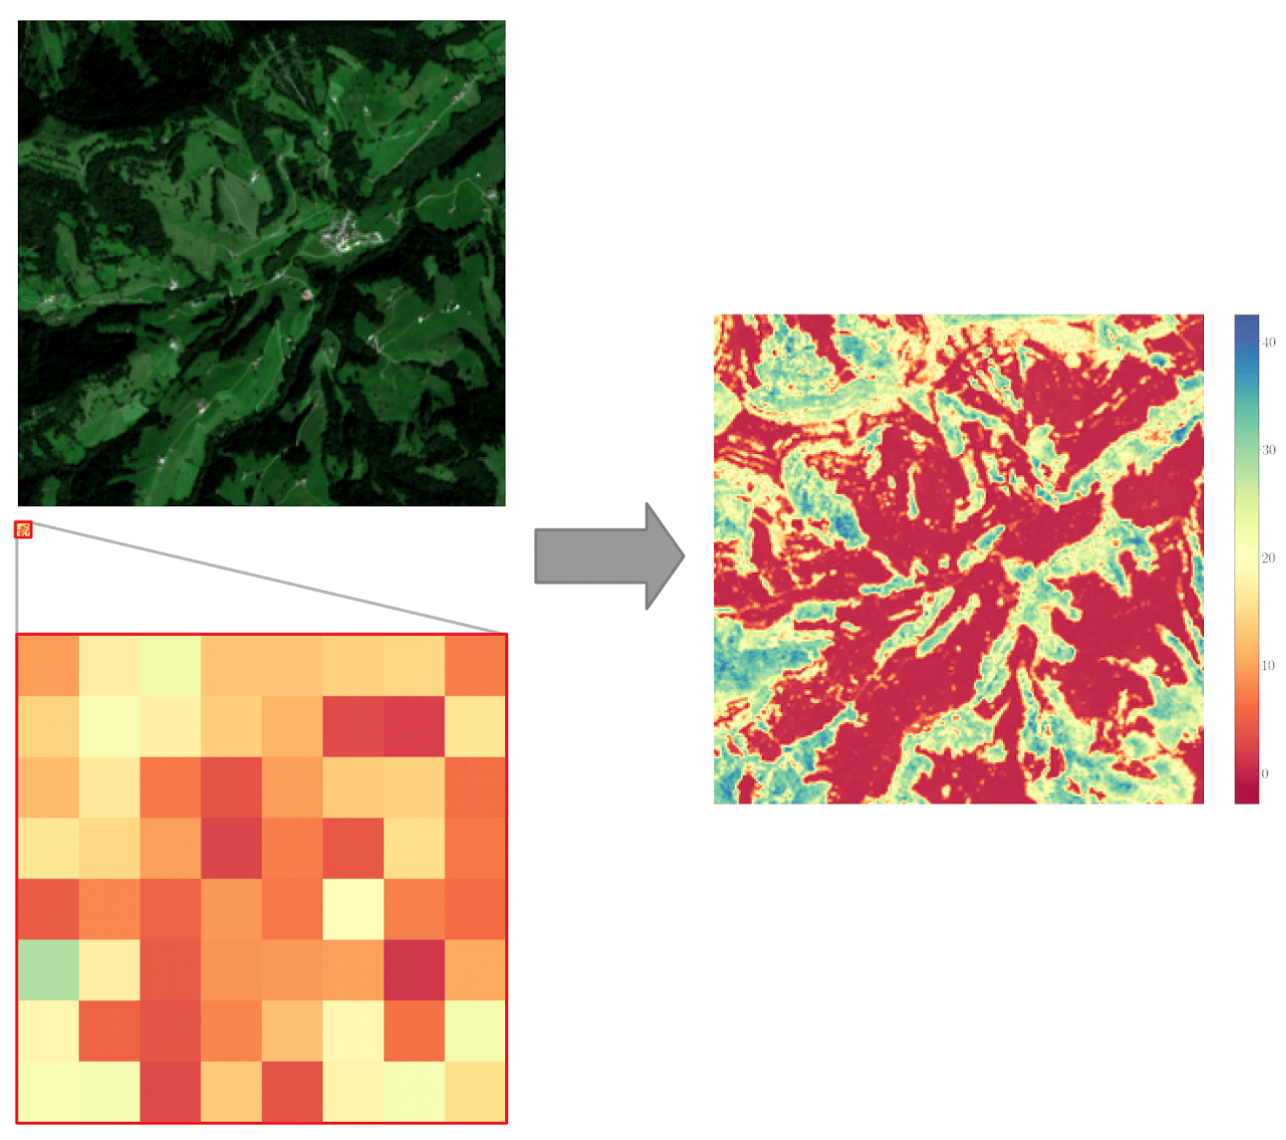
Our initial approach is based on the key observation that climatic and remote sensing data is rapidly growing in quantity and resolution making the quantity and resolution of species occurrence data the main limiting factor for many applications. There have been many methods that combine high-resolution environmental data to upsample species distribution data.This corresponds to the setup of guided super-resolution, which is a unifying framework for several computer vision tasks where the inputs are a low-resolution source image of some target quantity - e.g., a vegetation height map - and a high-resolution guide image from a different domain - e.g., a multispectral Sentinel-2 image; and the target output is a high-resolution version of the source, in our example a high-res vegetation height map (de Lutio et al. 2019).
Publication:
De Lutio, R., D'Aronco, S., Wegner, J.D., Schindler, K.: external pageGuided Super-Resolution as Pixel-to-Pixel Transformation, International Conference on Computer Vision (ICCV), 2019, pp. 8829-8837
Project partners: Swiss Federal Office for Agriculture (BLW), ETH IAS
Contacts:
Jan Dirk Wegner, ETH Zürich,
Stefano D'Aronco, ETH Zürich,
Riccardo De Lutio, ETH Zürich,
Frank Liebisch, ETH Zürich,
Jérôme Frei, BLW,